Skip to content

Daily weight,
smarter decisions

CowFIT gives you deeper understading on how your herd performs

Weight data used proactively

By monitoring weight data with CowFIT, you get early warnings when cows move outside their expected curve - allowing you to act before problems escalate. Data gives you a deeper understanding of how your herd performs - helping each cow reach its full potential.
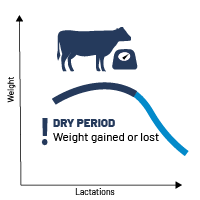
Cows weight change during dry period

Dry period

Changes in weight can create imbalances
that reduce productivity in the next
lactation. 
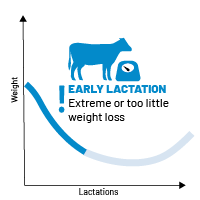
Cows weight change during early lactation

Early lactation

Severe weight loss signals that the cow is
not ready to breed again, while too little
loss can reduce production.
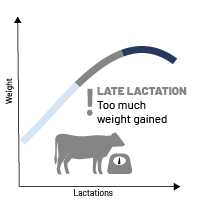
Cows weight change during late lactation

Late lactation

Excessive weight gain increases the risk of
weight loss during the dry period and can
negatively impact the next lactation.
CowFIT data empowers your

Feeding strategy and planning

The only way to change cow’s weight is by changing the diet. If the weight or weight change is too high or too low, you can adjust the energy concentration in the diet or the amount of feed the cow gets.

With CowFIT you are always on top of your tasks, ensuring your every cow’s wellbeing, optimising herd performance and securing the profitability of your dairy business.

On average you could earn an extra 100 € per cow per year. That comes from increased milk production and reduced costs related to improved reproduction, health, and survivability.

The economic benefits are calculated by the SimHerd simulation programme based on the Nordic conditions, which has a strong scientific foundation. The simulation model accounts for associations between milk production, health, reproduction, and climate impact. It simulates each cow in the herd over a 10-year period, and repeats it 100 times to ensure reliable results.

CowFIT data empowers your feeding strategy

The SimHerd simulation program calculated the accumulated effect on profitability that can be achieved by adjusting feeding based on CowFIT data. The data is the result of six different simulations based on two scenarios and three different levels of herd performance.

The two scenarios have the following conditions:

  Scenario 1 Scenario 2
% cows avoid weight loss in dry period 20% 40%
% cows inseminated in a positive energy balance 15% 30%
% cows avoid weight change in dry period 20% 40%
% cows avoid weight loss in late / early lactation 20% 20%

In each scenario, there are herds with three different performance levels in terms of yield, fertility, health, and feed efficiency in the following lactation. 


Effect on profitability (€ per cow per year) based on the Nordic conditions:

  Low Medium High

Herd
performance

+2.5% yield
-0.1 semen dose per pregnancy
-5% ketosis & milk fever
+1% feed efficiency
+5.0% yield
-0.2 semen dose per pregnancy
-10% ketosis & milk fever
+2% feed efficiency
+7.5% yield
-0.3 semen dose per pregnancy
-15% ketosis & milk fever
+3% feed efficiency
Scenario 1 +38€ +86€ +172€
Scenario 2 +57€ +118€ +204€


"CowFIT turns daily weight into profit.”

Søren Nørtoft Olesen
Chief Home Market Officer

Above 90% reliability on cow weight data

The CowFIT monitoring system has been thoroughly tested to validate data and ensure the highest possible reliability.

In selected herds, scales were placed below the CowFIT camera, so images and scale measurements of the cows were performed simultaneously. This data was used to develop breed-specific, AI-based prediction models that consider all data in the image into account.  

The prediction models are developed based on 21,000 images for Holstein, 19,000 for Jersey and 7,500 for Red Dairy Cattle.  The squared correlation (r2) between the scale measurement and CowFIT weight prediction was above 0.90 on the visit level for all three models. 

Farmers prefer not to have scales as a fixed installation, so the following verification of the CowFIT weight data has been performed based on comparison between on-farm image-based weight prediction and slaughter results, including slaughter weight and live weight (when available) on the same cows. 

The data shows that there is a high correlation between the measurements:  92-94% for live weight data and 90-91% for slaughter weight data, depending on the breed. Take a look at the detailed results. 

Not all cows get a live weight at the slaughterhouse. Some places do not measure this, and sometimes, the cow does not provide a meaningful record and, therefore, has no measure.
When comparing live weight, slaughter weight, and CowFIT weight, the results are always close, and the correlation is higher than 0.90. This means that the camera’s measurements and what is observed at the slaughterhouse directly relate to each other.

  Correlation between live weight and CowFIT weight Correlation between slaughter weight and CowFIT weight
Holstein 0.94 (671 cows) 0.91 (782 cows)
Jersey 0.92 (543 cows) 0,90 (586 cows)
Red Dairy Cattle 0.93 (478 cows) 0.91 (560 cows)

The CowFIT weight is generally a little higher than the live weight at the slaughterhouse. This also makes sense since the cow can only lose weight between leaving the herd and entering the slaughterhouse.

The CowFIT weight used in this analysis is the mean of all measurements taken in the seven days before slaughter. This also results in a lower standard deviation than the measurement taken at the slaughterhouse, which is only a single data point. 

We update this analysis continuously to confirm these results as more cows with CowFIT data are slaughtered.